Optical Integrity and Striae Detection: A Technical Guide to Schlieren Imaging in Glass Production
In high-precision glass manufacturing, internal inconsistencies often dictate the final yield quality. Industry practitioners frequently observe "ghosting" or "shimmer" in finished panes—subtle optical distortions where the glass appears wavy despite being physically flat.
These phenomena are identified as schlieren lines, or striae, which result from localized refractive index gradients. These "flow lines" typically stem from thermal inconsistencies during cooling or chemical inhomogeneities in the melt.
Mastering the detection of these gradients is essential for distinguishing premium architectural glass from industrial scrap. This guide provides a technical framework for transitioning from basic visual checks to a calibrated, high-sensitivity Schlieren imaging system.
"By following these protocols, you can effectively differentiate between line flow and branch flow to assess the internal structural consistency of the material."
Preliminary Diagnosis: The Three-Point Check
Execute this 30-second field diagnosis to determine if a defect is an internal Schlieren flow or simple surface contamination:
1. The Parallax Shift
Observe a distant grid through the glass while moving your head horizontally. If the distortion shifts at a rate different from surface reflections, the defect is confirmed as internal.
2. The Thermal Shadow
Use a heat gun on a low setting near the glass surface. If the lines fluctuate or change intensity, you are observing active thermal gradients. Static lines indicate "frozen-in" chemical striae.
3. The Edge-Light Test
Direct a high-intensity LED through the edge of the pane. If the light channels into distinct filaments, it suggests high-density flow lines, often reported as a result of insufficient mixing in the solution.
⚙️ Core Prerequisites & Tools Required
Visualizing phase shifts as amplitude variations requires a specific hardware configuration.
The Professional Kit
- ● Point Light Source: A high-brightness LED positioned behind a 50–100 micron pinhole.
- ● Collimating Optics: Two parabolic mirrors (f/8 or f/10) or large-diameter achromatic lenses.
- ● The Spatial Filter: A professional-grade razor blade or a high-precision adjustable slit.
- ● Imaging Sensor: A DSLR or industrial CMOS camera equipped with a long focal length lens (100mm+).
- ● Mounting: An optical rail or a heavy-duty vibration-isolated table.
Low-Cost Field Alternatives
1. The BOS Approach
(Background Oriented Schlieren): In the absence of mirrors, use a high-resolution speckle background. Software cross-correlation of images taken through the glass against a reference image allows you to deduce the presence of schlieren lines.
2. The Sun-Shadow Method
Utilize the sun as a distant point source. Position the glass 5–10 meters from a white screen. The schlieren lines frozen in the glass will cast a direct shadowgraph, providing a basic assessment for large industrial panes.
🪜 Step-by-Step Execution
Building the Diagnostic Rig with Precision
Aligning the Optical Axis (The Z-Type Configuration)
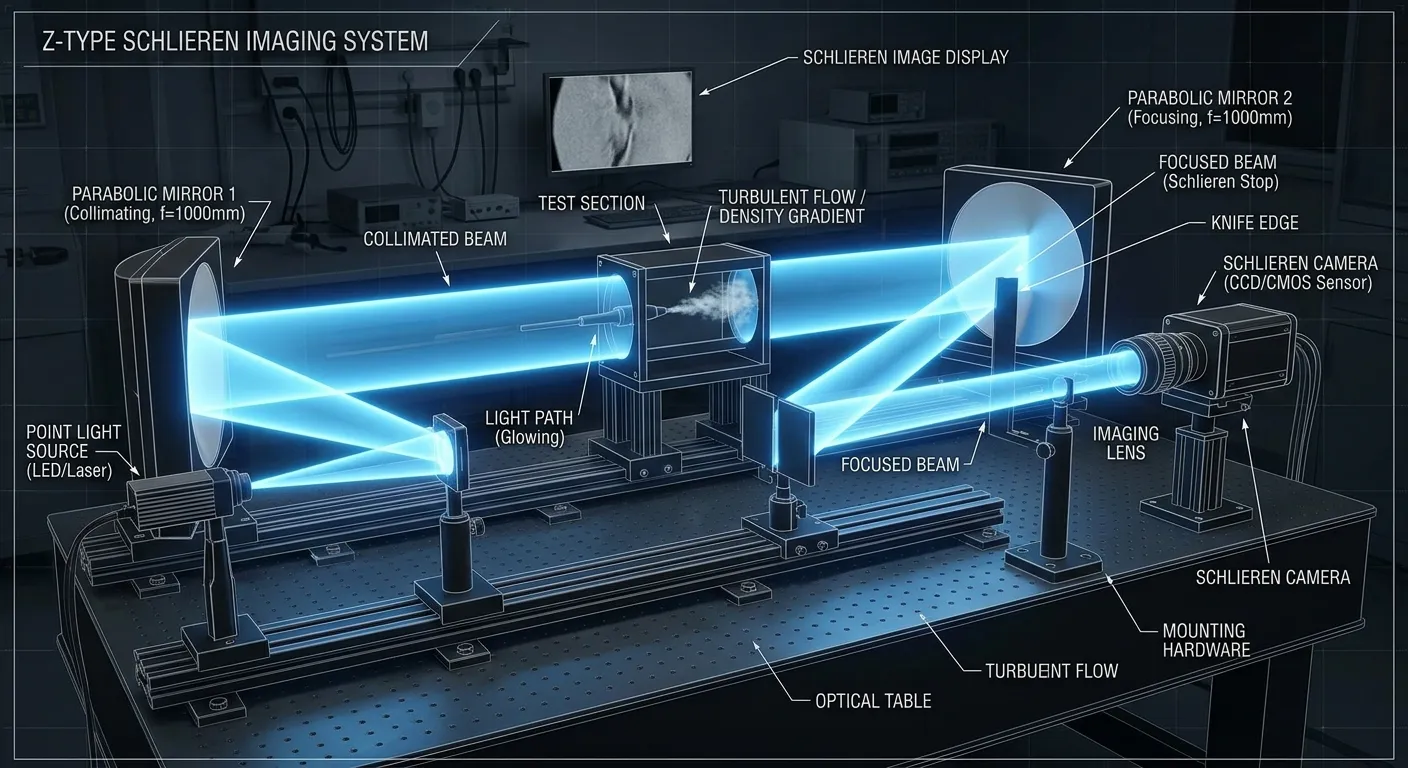
Utilize a Z-type setup to mitigate coma and astigmatism. Position two parabolic mirrors in an offset Z pattern. Place the light source at the focal point of the first mirror to project a collimated beam through the sample toward the second mirror.
Pro Tip: Verify collimation using a shear plate or by checking the beam diameter at two points several meters apart. Aligning the pulsed ruby laser (for high-speed testing) requires exact tolerances to prevent beam divergence.
Troubleshooting: If the image appears distorted or elliptical, the offset angle is likely too high. Maintain an angle of less than 10 degrees between the mirrors and the central axis to fix optical aberrations.
The Pinhole and the Central Lobe
The light from the LED must be brought to a sharp focus. This process creates a diffraction-limited point rather than a simple light projection.
Pro Tip: Adjust the pinhole until a clean Airy disk is visible. You must pass the central lobe of the diffraction pattern while you block the outer lobes. This ensures spatial coherence, which is critical for detecting the minute angle of incidence changes caused by striae.
Troubleshooting: Grainy light indicates dust on the pinhole edges. Clean the component with compressed air to restore clarity.
Diffraction Pattern Visualization
Applying the Spatial Filter (The Knife-Edge)
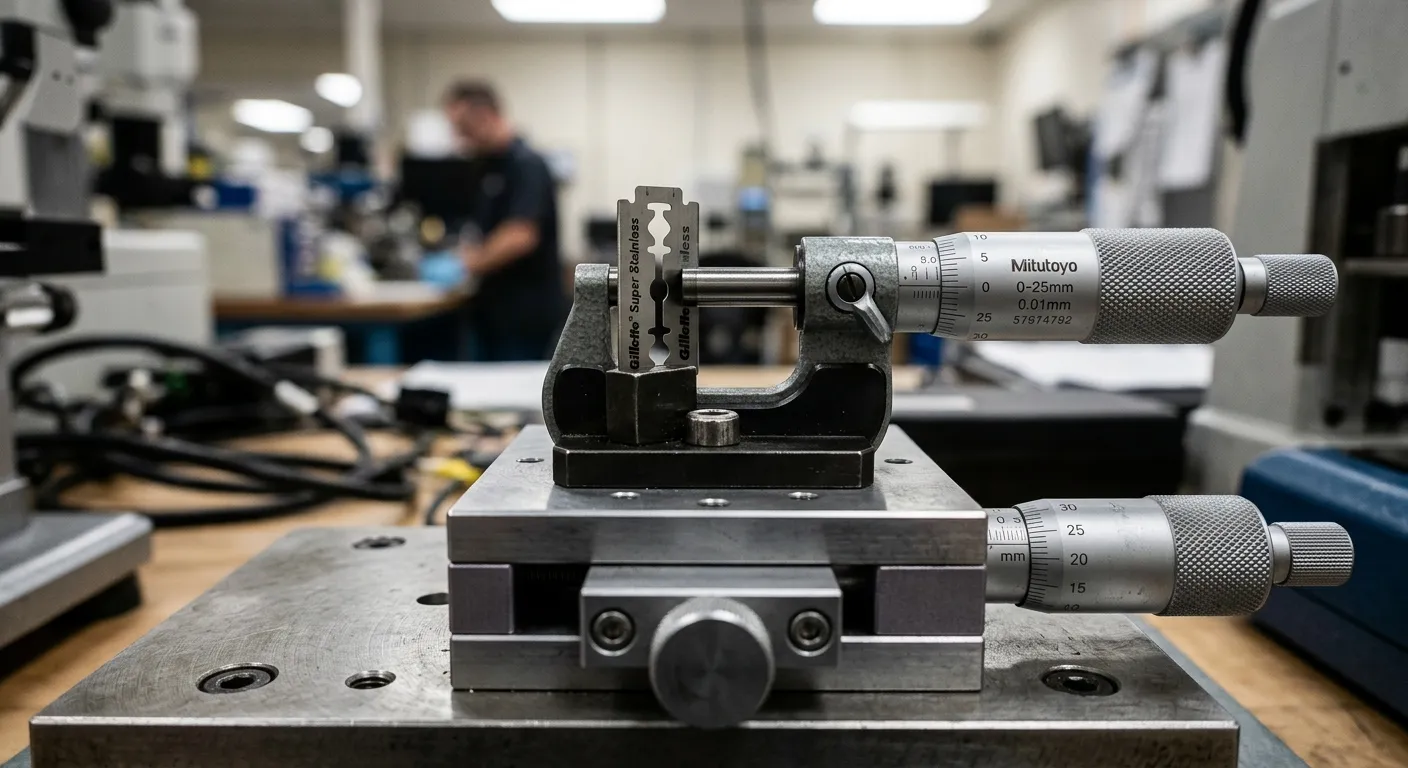
This stage is critical for converting phase changes into visible contrast. Mount a razor blade on a micrometer stage at the focal point of the second mirror.
Pro Tip: Slowly advance the blade until it blocks about half of the light beam. The camera image should reach a uniform gray state, representing the point of maximum sensitivity. At this setting, refractive index gradients will bend light either toward or away from the blade, creating distinct bright and dark lines.
Troubleshooting: If the image transitions from bright to pitch black instantly, the blade is not on the exact focal plane. Adjust the blade stage along the optical axis until the light fades gradually.
Visual Inspection and Decoding Flow Types
Insert the glass sample into the collimated beam and perform a visual inspection of the Schlieren image on the monitor.
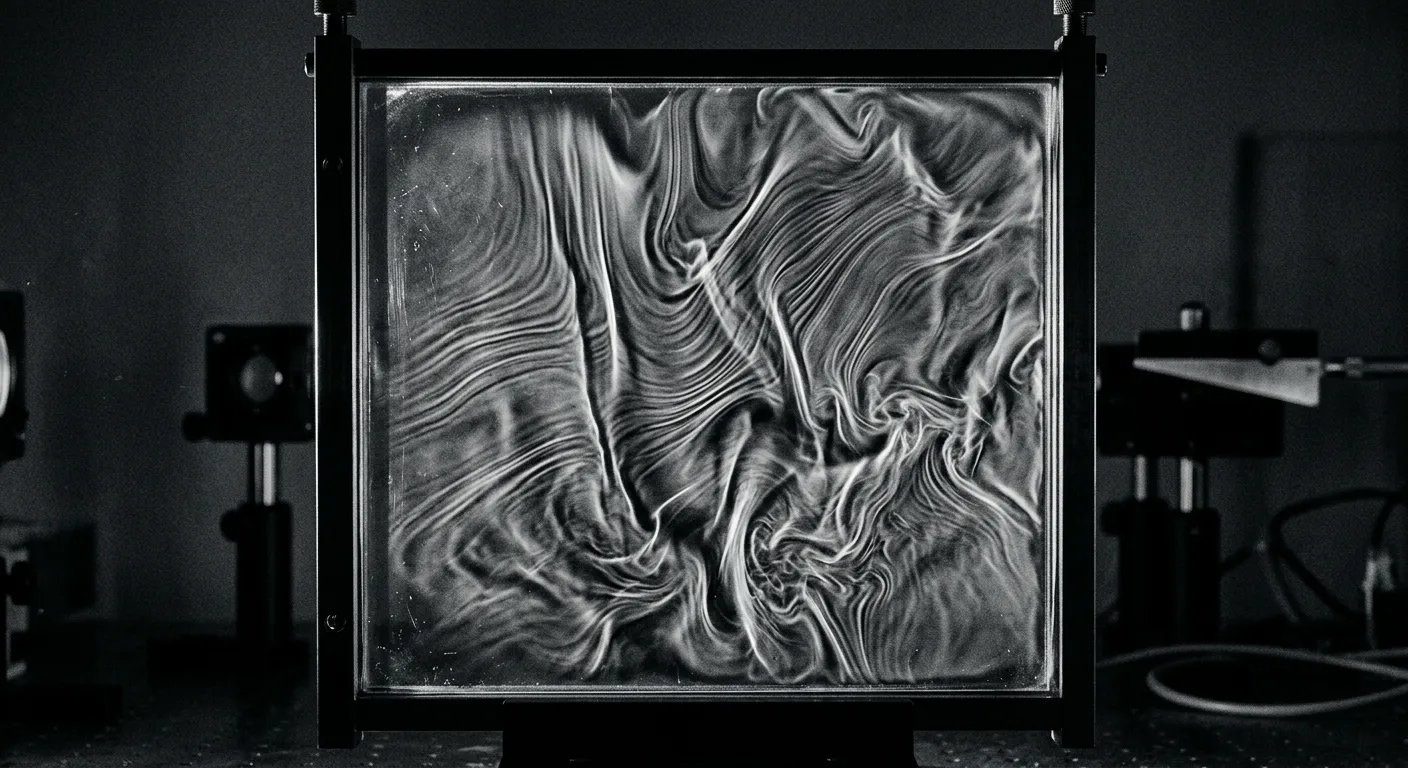
Pro Tip: Differentiate between line flow and branch flow. Line flow (parallel striations) typically indicates a "draw" issue where glass was pulled too fast. Branch flow (chaotic patterns) suggests chemical "reams" or poor homogenization of raw materials.
Troubleshooting: To stabilize the environment, introduce replacement air at low-velocity. High-velocity air creates its own Schlieren effect that masks glass defects. Ensure you seal gap behind appliances or lab equipment to prevent drafts from interfering with the reading.
Quantifying the Angle of Refraction
To achieve quantitative data, you must determine the magnitude of the light's deflection.
Pro Tip: Use a calibrated standard to establish system sensitivity. By measuring the angle of incidence of the refracted rays, you can calculate the refractive index change ($\Delta n$), helping to verify if the glass meets industry-reported standards for clarity.
Troubleshooting: If the image is too dim, minimize the beam intensity at the focus by upgrading the LED power, but avoid exorbitant attenuation by ensuring the knife-edge does not over-cut the beam.
⚠️ Critical Mistakes to Avoid
1. Ignoring Thermal Plumes
Technicians often mistake heat from their hands for material defects. Handle samples with insulated gloves and allow the glass to reach thermal equilibrium with the room.
2. Over-Sensitivity
Cutting too much of the beam can make the system sensitive to sound waves or building vibrations. If the image appears as "static," back off the knife-edge slightly.
3. Neglecting Mirror Maintenance
Dust or scratches on mirrors appear as permanent defects in the image. Always map the empty system first to distinguish mirror artifacts from sample defects.
❓ Hardcore FAQ
Q: How do I distinguish a surface scratch from an internal Schlieren line?
A: Surface scratches show sharp, high-contrast edges and diffraction "ringing." Internal lines appear as soft, graded transitions representing the smooth flow of the refractive index.
Q: Is this applicable to laminated glass?
A: Yes, though laminated glass involves multiple interfaces. You may observe the Schoch effect (lateral beam displacement) at the interlayer, which is often used in industry observations to assess adhesion quality.
Q: Why does the image look flattened in one direction?
A: This occurs when using a vertical knife-edge to detect horizontal gradients. To capture the full "chaos," rotate the knife-edge 90 degrees or use a circular Schlieren stop.
Q: What is the limit of detection?
A: A properly aligned Z-type system can detect refractive index changes as small as $10^{-6}$. In industrial contexts, this allows for the identification of "reams" that are otherwise invisible to the naked eye.
Q: How does chemical striae differ from thermal lines?
A: Chemical-based lines are permanent. Thermal lines typically dissipate if the glass undergoes a professional annealing cycle. If lines persist after annealing, it indicates a chemical mixing issue in the furnace.